Appearance
Mosaic Documentation
Data Organization and Definitions
Data in Mosaic is organized into just 4 types: Projects, Samples, Attributes, and Files. This is a simple organizational scheme that is flexible enough to accommodate many different types of biomedical projects.
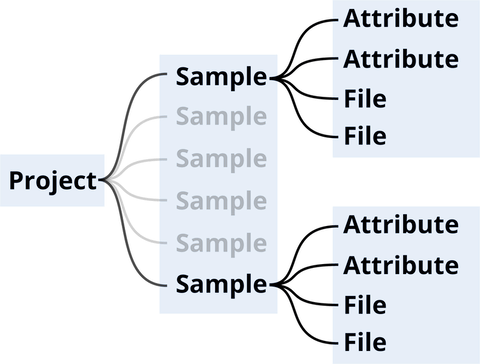
Project
A project is a selection of Samples + Users. Projects provide a more sophisticated layer of organization on top of Cloud buckets and/or file system directories. Projects allow you to organize your data in multiple ways and across multiple datasets without duplication. For example, a project of only smokers homozygous for a specific variant.
Sample
A sample is a group of Files and Attributes that are all associated with the same specimen. A sample can be a person, animal, or even specific experiment, depending on your dataset and how you decide to organize it.
Attribute
An attribute is a piece of information that is attached to a Sample. An attribute could be phenotype data, metadata, quality values, or even a specific annotation of interest. Some examples would be Birthdate, Height, Medium_Grown, Is_Affected, Cancer_Type, etc. Attributes can be a single value (e.g. Birthdate) or an array of values (e.g. Alignment_Read_Coverage). Attributes are used to generate distributions, charts, cohorts, filters, and more.
File
A file in Mosaic is really just a standard file and is associated with a Sample. When you create a sample, you often do this by selecting a number of Files that constitute the genomic data for that sample. The most common types being alignment files (bam, cram) and variant files (vcf), however you can associate other files for easy organization.
Projects
The projects page contains all projects you have access to.
Create a New Project
To create a project go to the projects page and click the create new project button  in the top right hand corner of the page. Fill out a project name, description and reference and finally click Create Project. Once you have a project, you'll probably want to add samples, see Add Samples (Once in html add a link to the Add Samples section below) below for more information.
Project
Dashboard
The Dashboard page is a quick overview of your project as well as a place to communicate with other users in this project.
Add Chart to the Dashboard
To add an attribute/chart to the Dashboard, go to the Analytics page. If the chart of interest is not already on the analytics page, you can add it via the Select Chart button at the top of the page. Once the chart has been added, open the chart’s menu via the ellipsis on the bottom right of the Chart's card and select Pin to Dashboard. The Chart will now show up on the Dashboard.
Remove Chart from the Dashboard
On the Project Dashboard open the ellipsis menu on the bottom right of the Chart's card and select Unpin from dashboard.
What Role am I?
To determine your role for a particular project, look towards the bottom in the left sidebar to see your role  .
.
There are 4 possible roles: Project Owner, Admin, Member, and Viewer.
Samples Page
The samples page is for quickly seeing, accessing, and comparing the samples in a project. The main feature is the table, containing a list of the samples in the current project. The table can contain simple values ("5") or inline charts  .
.
The table is very useful for quickly scanning lots of samples to get a sense of what values or chart structures are "normal" or perhaps worth further investigation.
Edit Columns
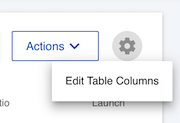
The samples table is customizable with any attribute being able to be added (or removed) as a column to the table. To do this, select the gear icon in the top right of the table header and select the Edit Table Columns menu item.
Create Filter
To create an attribute filter on the samples table, you must go to Analytics and create a filter there (see Create Filter below). Any active filters created on the analytics page will persist and affect the samples table. For example, if you create a filter on the Analytics page where only 2 samples are passing, then the samples table will only have two samples. To remove a filter on the samples table, go to Analytics and select the Clear Filter(s) button.
Export Sample Names
A list of sample names in the table can be exported by selecting the ellipsis in the top right of the table header and then selecting the Export Sample Names menu item.
Add Samples
The free version of Mosaic currently only supports adding samples that are being hosted on AWS S3. You will need access to the AWS account so that you can give Mosaic read-only access. If you do not have access, please ask your cloud administrator for help.
Then select the Add Samples button  . This will open up the step-by-step wizard, which will guide you through creating the authorization and selecting the files.
Analytics Page
The analytics page is for exploring, understanding, and investigating the project and its samples. Here every attribute in your project is available as an interactive chart.
Create Attribute (Phenotype) Filter
Attribute filters are created by interacting directly with the chart. For bar charts, drag left and right to select the area you are interested in. A filter will automatically be created that will remove all samples that do not have a value in the selected range for the given attribute. For pie charts, click on the slice (or slices) of the pie that you are interested in. A filter will automatically be created just like for bar chart. At the top of the page all filters can be seen as badges.
Create Genotype Filter
Genotype filters can be used on the analytics page to filter samples and quickly create cohorts, but the actual creation of the filter is done on the Variants page. See Create a Genotype Filter for more information.
Remove Filter
You can remove all filters by clicking the Clear Filters button on the analytics page  . Additionally, you can remove individual attribute filters by deselecting the filter on the chart. For bar charts, you can click anywhere outside the selected region to remove the filter. For pie charts, clicking the selected slice a second time will deselect it.
Add a new Chart / Attribute
To add a chart, you simply add an attribute to Mosaic. Every attribute in Mosaic can be visualized as a chart on the Analytics page. Click on the Attributes link in the side bar and then click on the Add Attributes tab at the top of the page. Once there follow the instructions on how to add an attribute. After the attribute has been added, you can select the new chart by going back to the Analyics page and selecting the new chart from the Select Chart modal.
Variant Warehouse
The variant warehouse is a realtime query engine for interacting with all variant and genotype data for your project. Here you can search, filter, sort, and create an analytics filter based on the samples that have the selected variants. To maintain speed, we have restricted the search results to requires 1500 or less variants. If you perform a search with more than 1500 variants, then you will receive a message instructing you to apply a more strict set of filters.
Search for variants by Gene
Start typing your gene of interest and a drop-down list will appear to autofill out your gene. You can add as many genes as you like. When you are ready, click Apply Filter to start the search.
Create a Genotype Filter for the Analytics Page
You may decide you want to view the charts and phenotype information on the analytics page for only the samples that contain a specific variant or group of variants. You can do this by creating an analytics filter from the Variants page. First, select the variants of interest, then click the Get Samples button, then select the genotype, and finally click Go To Analytics. This will take you to the analytics page with a Genotype Filter.
Get all Sample IDs that contain a specific Variant
To achieve this, start by creating a Genotype Filter as described above. Once you are on the Analytics page, select the ellipsis next to the Select Charts button and click Export Sample Names.
Add additional or custom annotations (Enterprise Only)
Custom annotations can be added to the variant warehouse, but is not available on the basic plan. If you are interested in adding your own or additional annotations, please contact us to inquire about the enterprise plan.
Genes
Table
The genes table contains an extensive list of genes that can be used throughout Mosaic, and with additional applications. The genes in this table are as defined by RefSeq and GENCODE.
Sets
A gene set is a saved list of genes, created by manually selecting genes in the genes table, or pasting in your own list of genes. These gene sets can be passed to applications when launched through Mosaic.
Project Settings
Change project settings
Adding and removing users is the main way people can gain access to samples. To add a user to a particular project, go to the Project of interest, then select the Settings link in the left sidebar. If you do not see the Settings link then your role in that project is not authorized to add users. Only Members, Project Owners, and Admins have the ability to add users to a project.
Add/Remove Users
Follow the instructions in Change Project Settings to get to the Settings menu. Once you have clicked on Settings, click on the Collaborators & Permissions menu item. Here you can add/remove a user to a project and assign or change their role. By default all new users will be a Viewer, so make sure to select the appropriate role after you've added them.
Roles & Permissions
Mosaic has a role-based access system that lets users easily be added to a project with the appropriate set of authorizations. Mosaic has 4 types of roles: Owner, Admin, Member, Viewer.
| Viewer | Member | Admin | Owner | |
|---|---|---|---|---|
| View Project | x | x | x | x |
| Create Conversations | x | x | x | |
| Create Comments | x | x | x | |
| Add/Remove Users | x | x | ||
| Add/Remove Samples | x | x | ||
| Change User's Role | x | x | ||
| Access Project Settings | x | x | ||
| Add/Remove Owners | x |
Samples Processing
When you add samples to a project in Mosaic, a number of statistics and metrics are generated from them to populate some of the attributes and charts.
Basic Plan
For the basic plan, all metrics are generated via sampling the data (BAM, CRAM, VCF). Sampling is very accurate for many types of metrics (e.g. rates) and the values we generate are very likely to be accurate, although we can not guarantee it. There are some metrics (such as Variant Count), which are less amenable to a sampling approach and therefore are not offered as part of the basic plan.
Enterprise & Pro Plans
For enterprise and pro plans, all metrics are generated via fully processing the data (BAM, CRAM, VCF). This guarantees an accurate value and also enables more metrics to be generated such as Variant Count, Total Reads, etc.
3rd-Party Web Applications
Mosaic integrates with a number of external web applications that can be securely launched directly from Mosaic. For more information about client applications, view the full client application documentation.
API
Mosaic offers a full API which can be seen at https://mosaic.frameshift.io/api. At the moment only pro and enterprise plans can interact with Mosaic via the API, though that may change in the future.